Allure Framework
Allure Framework is a flexible lightweight multi-language test report tool that not only shows a very concise representation of what have been tested in a neat web report form, but allows everyone participating in the development process to extract maximum of useful information from everyday execution of tests.
From the dev/qa perspective Allure reports shorten common defect lifecycle: test failures can be divided on bugs and broken tests, also logs, steps, fixtures, attachments, timings, history and integrations with TMS and bug-tracking systems can be configured, so the responsible developers and testers will have all information at hand.
From the managers perspective Allure provides a clear 'big picture' of what features have been covered, where defects are clustered, how the timeline of execution looks like and many other convenient things. Modularity and extensibility of Allure guarantees that you will always be able to fine-tune something to make Allure suit you better.
About
Copyright
The Allure reference guide is available as HTML documents. The latest copy is available at https://docs.qameta.io/allure/
Copies of this document may be made for your own use and for distribution to others, provided that you do not charge any fee for such copies and further provided that each copy contains this Copyright Notice, whether distributed in print or electronically.
Get Help
There are several places to get help:
Contact the community on Gitter. We also have a Russian-speaking room.
Ask a question on Stack Overflow or Stack Overflow in Russian.
Report bugs in GitHub issues.
How to Proceed
Open the demo version to see what an Allure report looks like.
Go to Get started to build a report for an existing project.
Learn more about report structure and features.
Integrate your favorite testing framework with Allure. Supported frameworks are grouped by language:
Java, Python,JavaScript,Ruby,Groovy,PHP,.Net, andScala.
Get Started
To generate your first report you will need to go through just a few simple steps:
Downloading and installing Allure commandline application suitable for your environment.
Locating test execution data that you have to build a report on.
Installing a commandline
Several options for Allure installation are currently supported:
Linux
For debian-based repositories a PPA is provided:
sudo apt-add-repository ppa:qameta/allure
sudo apt-get update
sudo apt-get install allure
sudo apt-add-repository ppa:qameta/allure
sudo apt-get update
sudo apt-get install allureMac OS X
For Mas OS, automated installation is available via Homebrew
brew install allurebrew install allureWindows
For Windows, Allure is available from the Scoop commandline-installer.
To install Allure, download and install Scoop and then execute in the Powershell:
scoop install allurescoop install allureAlso Scoop is capable of updating Allure distribution installations. To do so navigate to the Scoop installation directory and execute
\bin\checkver.ps1 allure -u\bin\checkver.ps1 allure -uThis will check for newer versions of Allure, and update the manifest file. Then execute
scoop update allurescoop update allureto install a newer version. (documentation)
Manual installation
Download the latest version as zip archive from Maven Central.
Unpack the archive to allure-commandline directory.
Navigate to
bindirectory.Use
allure.batfor Windows orallurefor other Unix platforms.Add
allureto systemPATH.
WARNING
To run commandline application, Java Runtime Environment must be installed.
TIP
Older releases (⇐ 2.8.0) are available on bintray.
Check the installation
Execute allure --version in console to make sure that allure is now available:
$ allure --version
2.0.1
$ allure --version
2.0.1Test execution
WARNING
If you are using IDE to run tests locally it may ignore Allure configuration specified in build file (as IntelliJ IDEA does). In order to make it work consider using allure.properties file to configure Allure. Check out configuration section for more information.
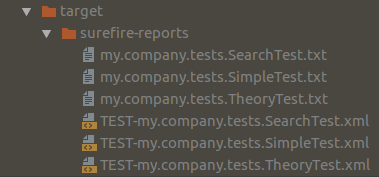
Before building a report you need to run your tests to obtain some basic test report data. Typically it might be a junit-style xml report generated by nearly every popular test framework. For example, suppose you have test reports automatically created by surefire maven plugin stored in the target/surefire-reports:
Report generation
This is already enough to see the Allure report in one command:
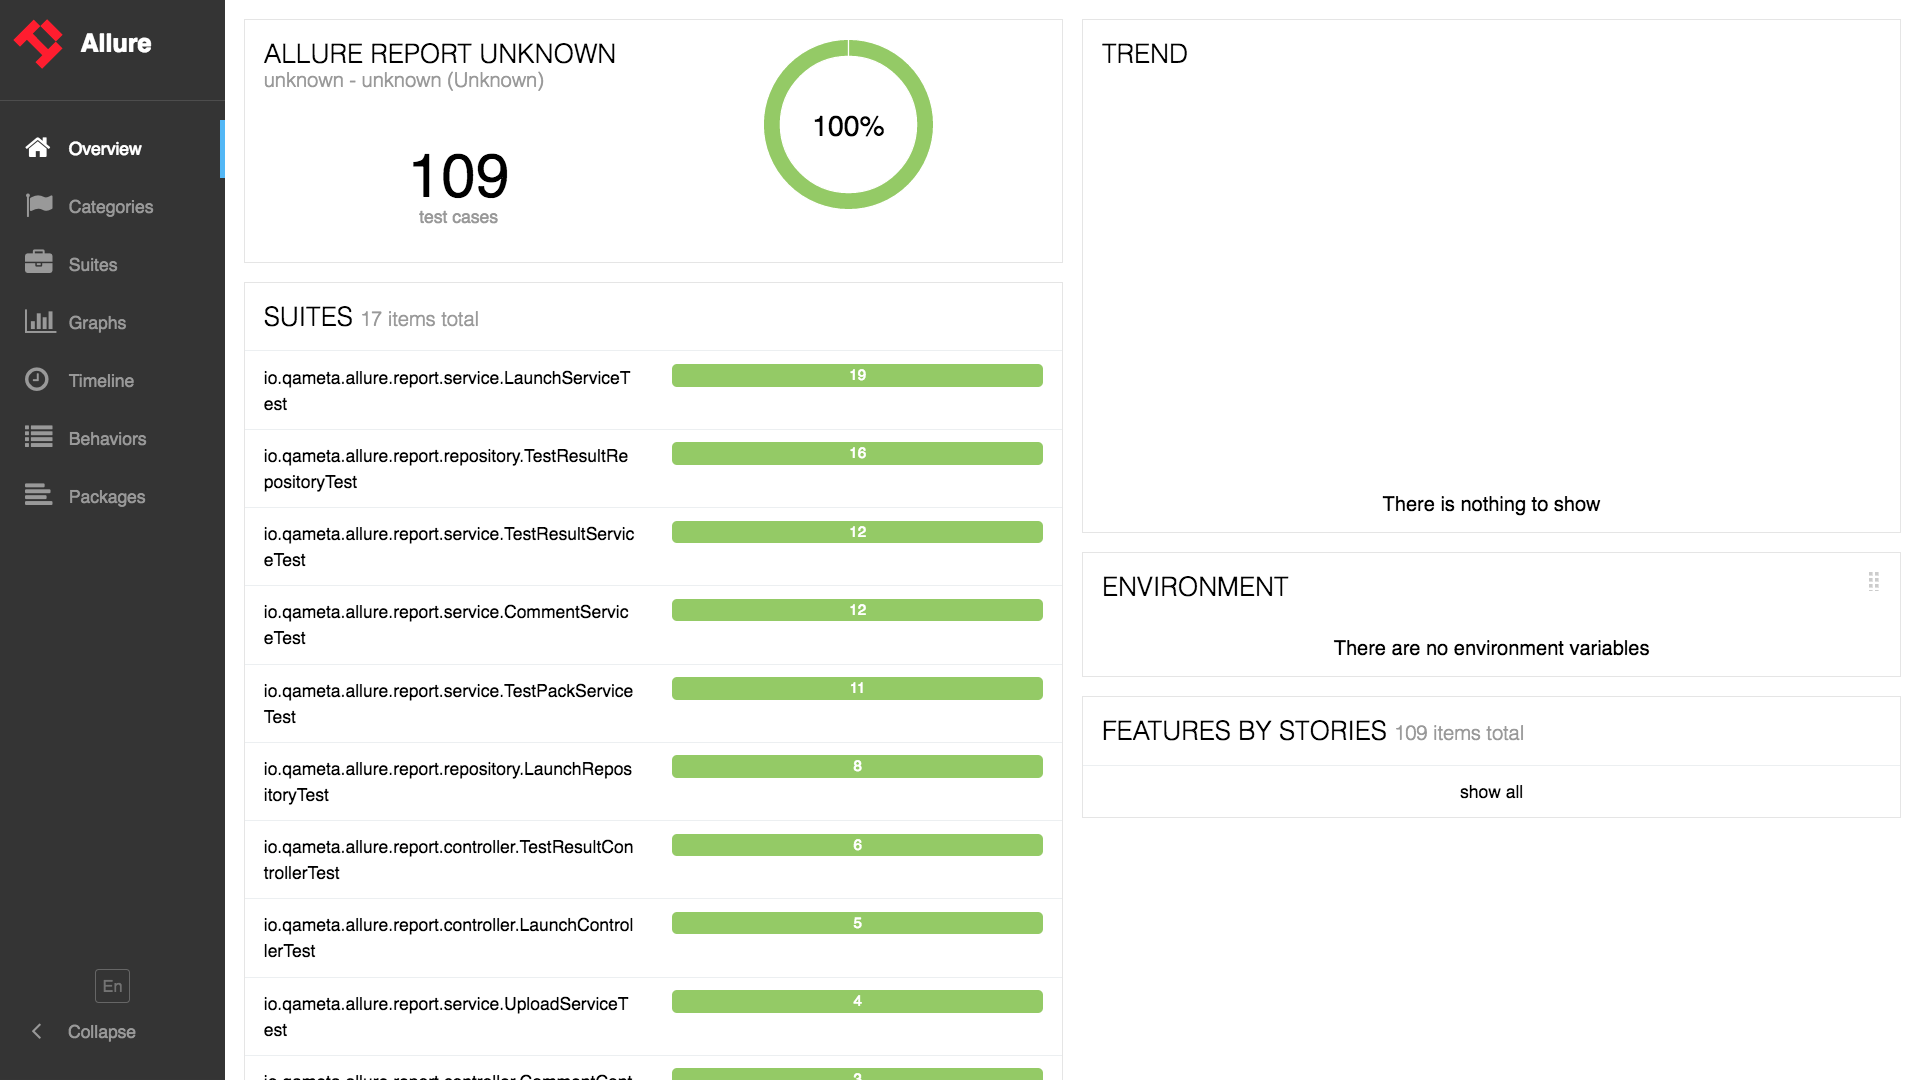
allure serve /home/path/to/project/target/surefire-reports/allure serve /home/path/to/project/target/surefire-reports/Which generates a report in temporary folder from the data found in the provided path and then creates a local Jetty server instance, serves generated report and opens it in the default browser. It is possible to use a --profile option to enable some pre-configured allure setting. junit profile is enabled by default, you will learn more about profiles in the following section.
This would produce a report with a minimum of information extracted from the xml data that will lack nearly all of the advanced allure features but will allow you to get a nice visual representation of executed tests.
Report structure
Once you’ve got the idea what the report does look like. You will probably want to get more data-rich reports. You might have to consider using one of the Allure adaptors for your testing framework, which will allow to collect much more information. Jump to the integrations section to learn more about integration with testing frameworks.
Typical report consists of 'Overview' tab, navigation bar, several tabs for different kinds of test data representation and test case pages for each individual test. Each Allure report is backed by a tree-like data structure, that represents a test execution process. Different tabs allow to switch between the views of the original data structure thus giving a different perspective. Note that all tree-like representations including Behaviors, Categories, xUnit and Packages support filtering and are sortable.
Overview page
Entry point for every report would be the 'Overview' page with dashboards and widgets:
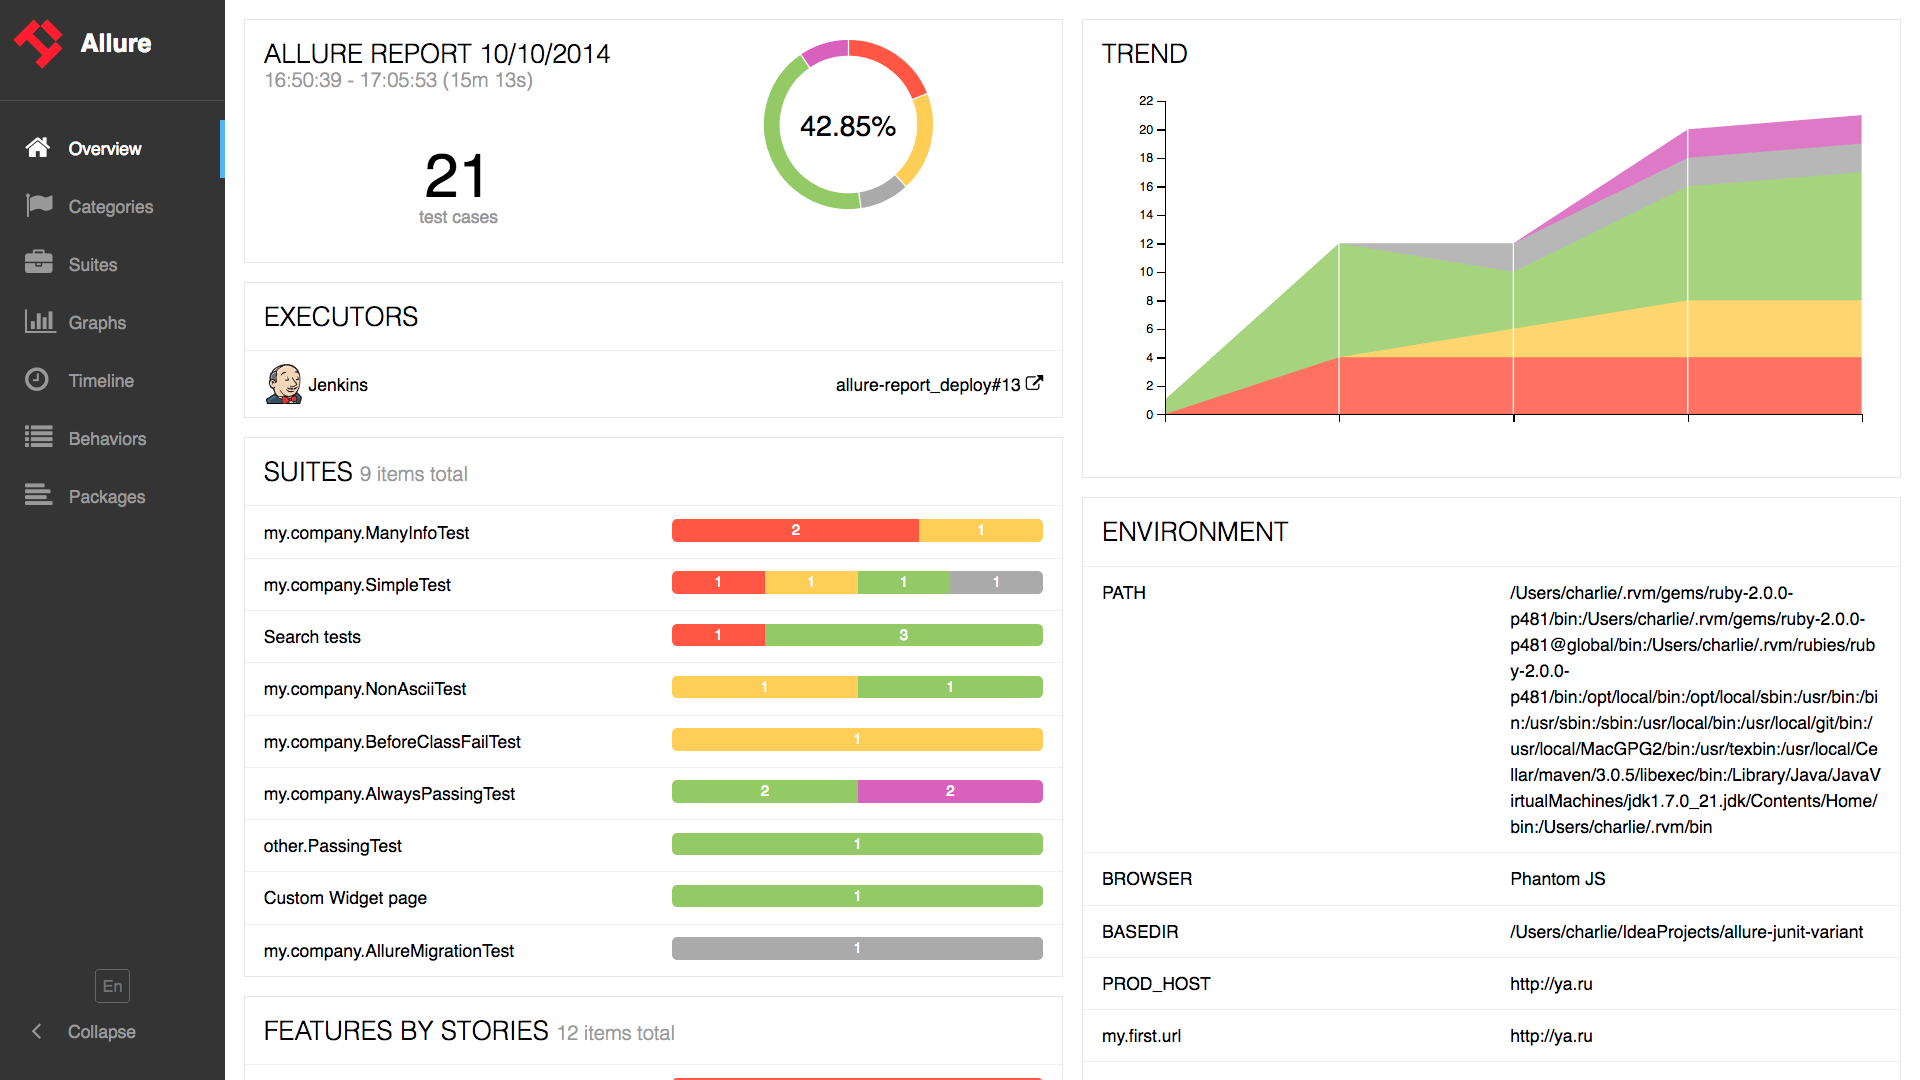
Overview page hosts several default widgets representing basic characteristics of your project and test environment.
Statistics - overall report statistics.
Launches - if this report represents several test launches, statistics per launch will be shown here.
Behaviors - information on results aggregated according to stories and features.
Executors - information on test executors that were used to run the tests.
History Trend - if tests accumulated some historical data, it’s trend will be calculated and shown on the graph.
Environment - information on test environment (see how to define environment).
Home page widgets are draggable and configurable. Also, Allure supports it’s own plugin system, so quite different widget layouts are possible.
Navigation bar is collapsible and enables you to switch into several of the basic results overview modes.
Categories
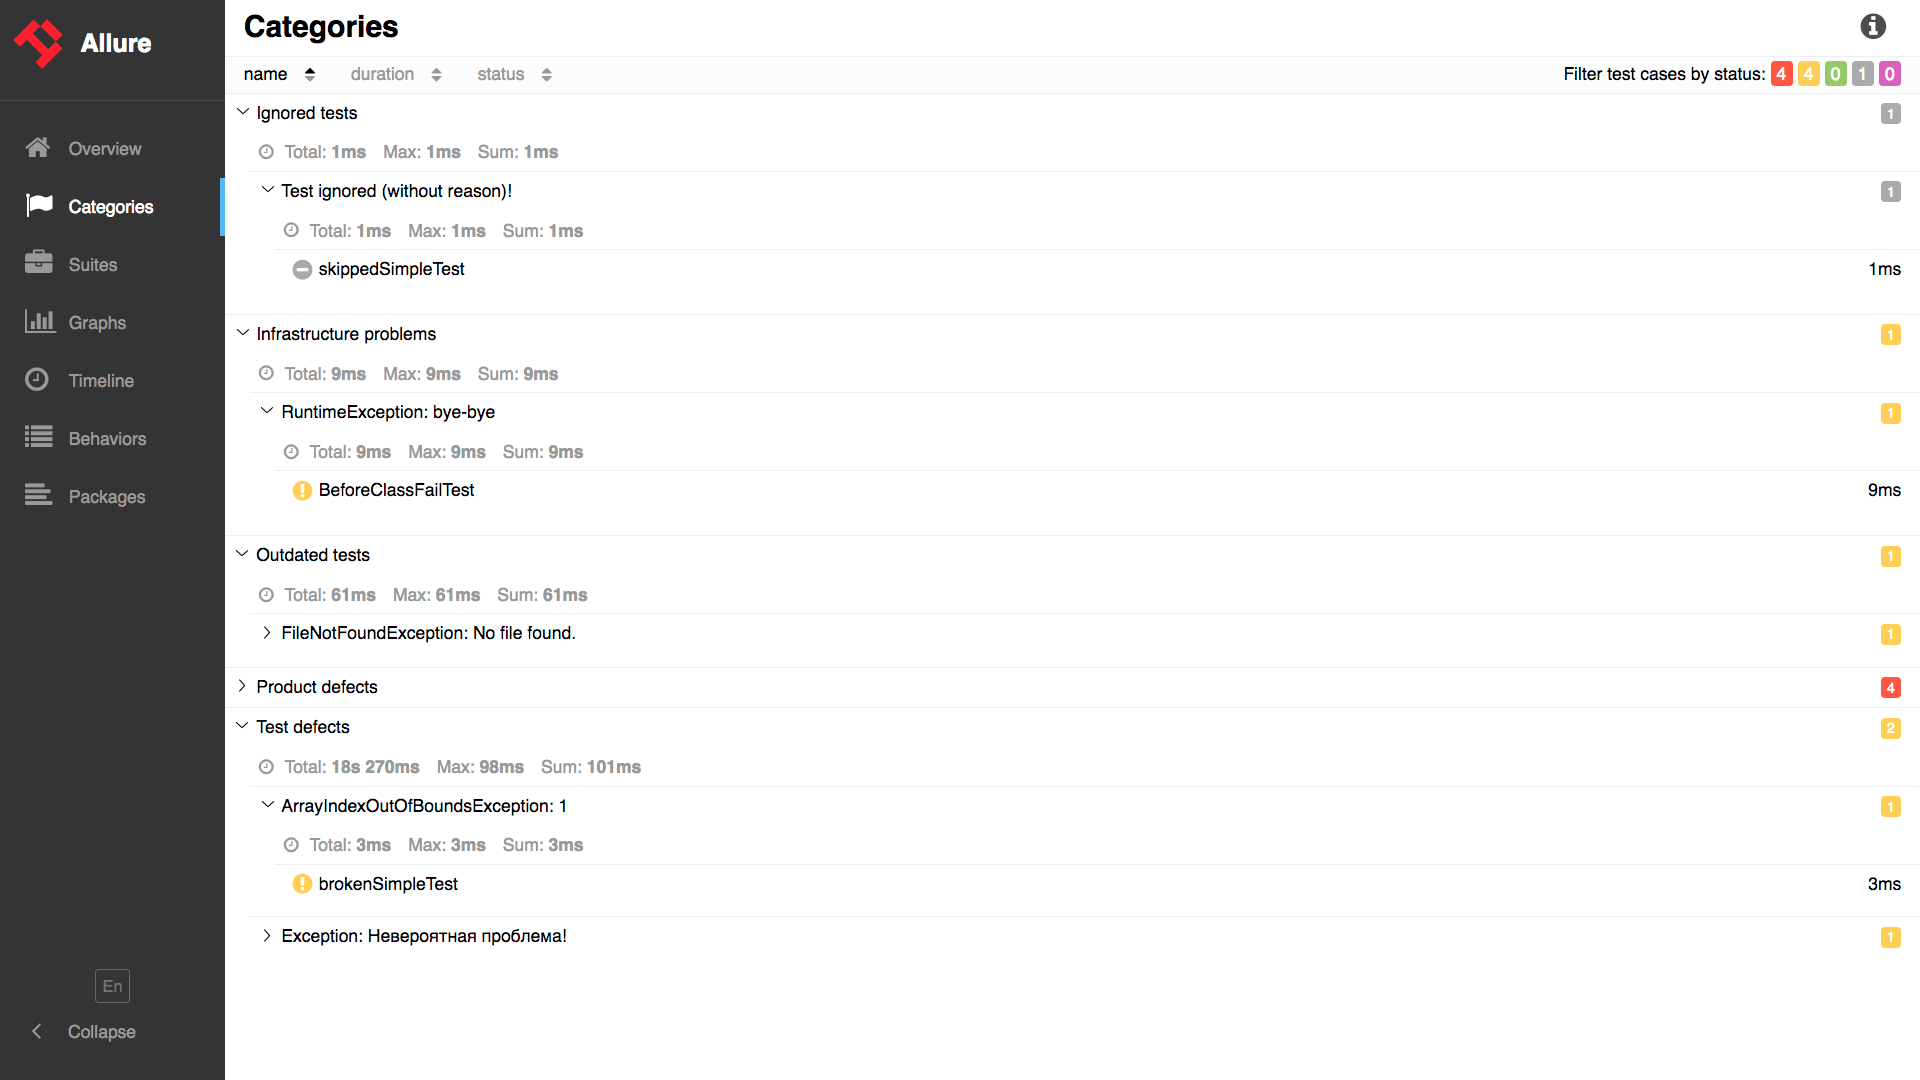
Categories tab gives you the way to create custom defects classification to apply for test results.
Suites
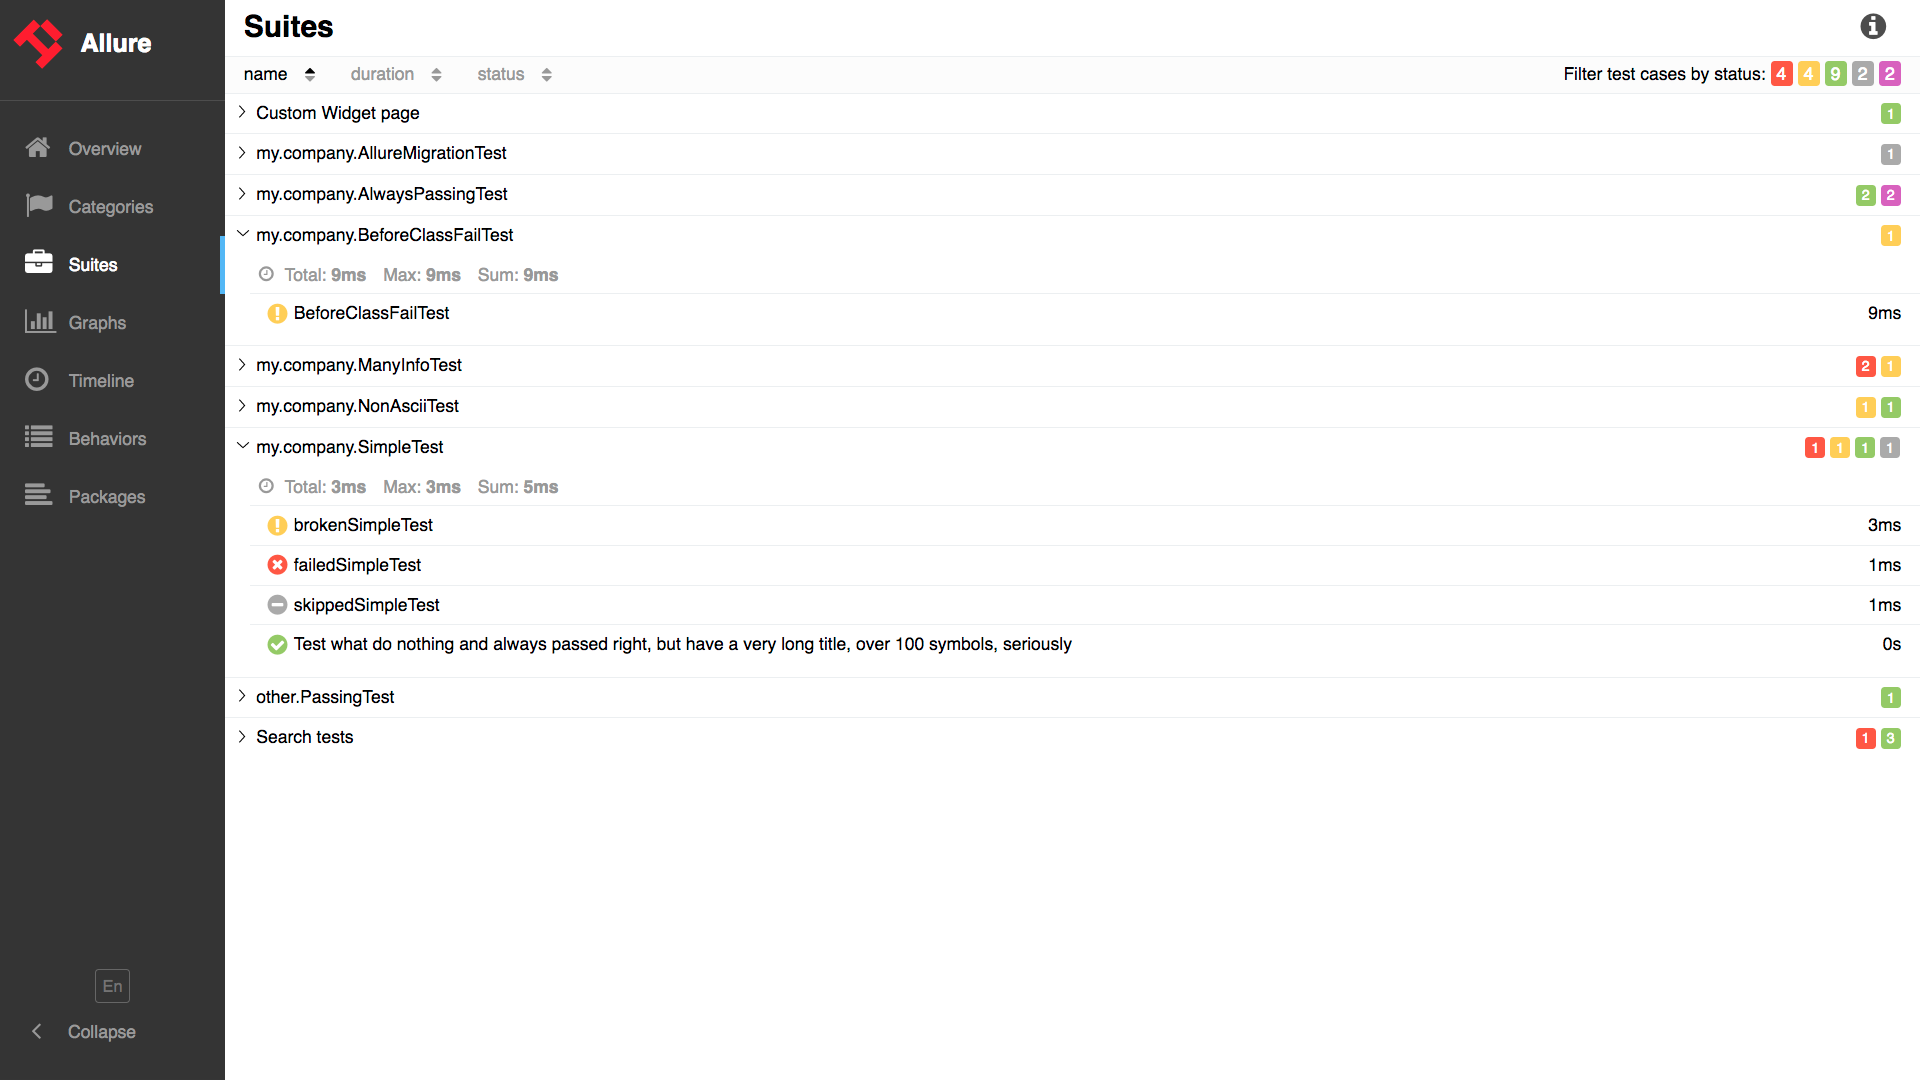
On the Suites tab a standard structural representation of executed tests, grouped by suites and classes can be found.
Graphs
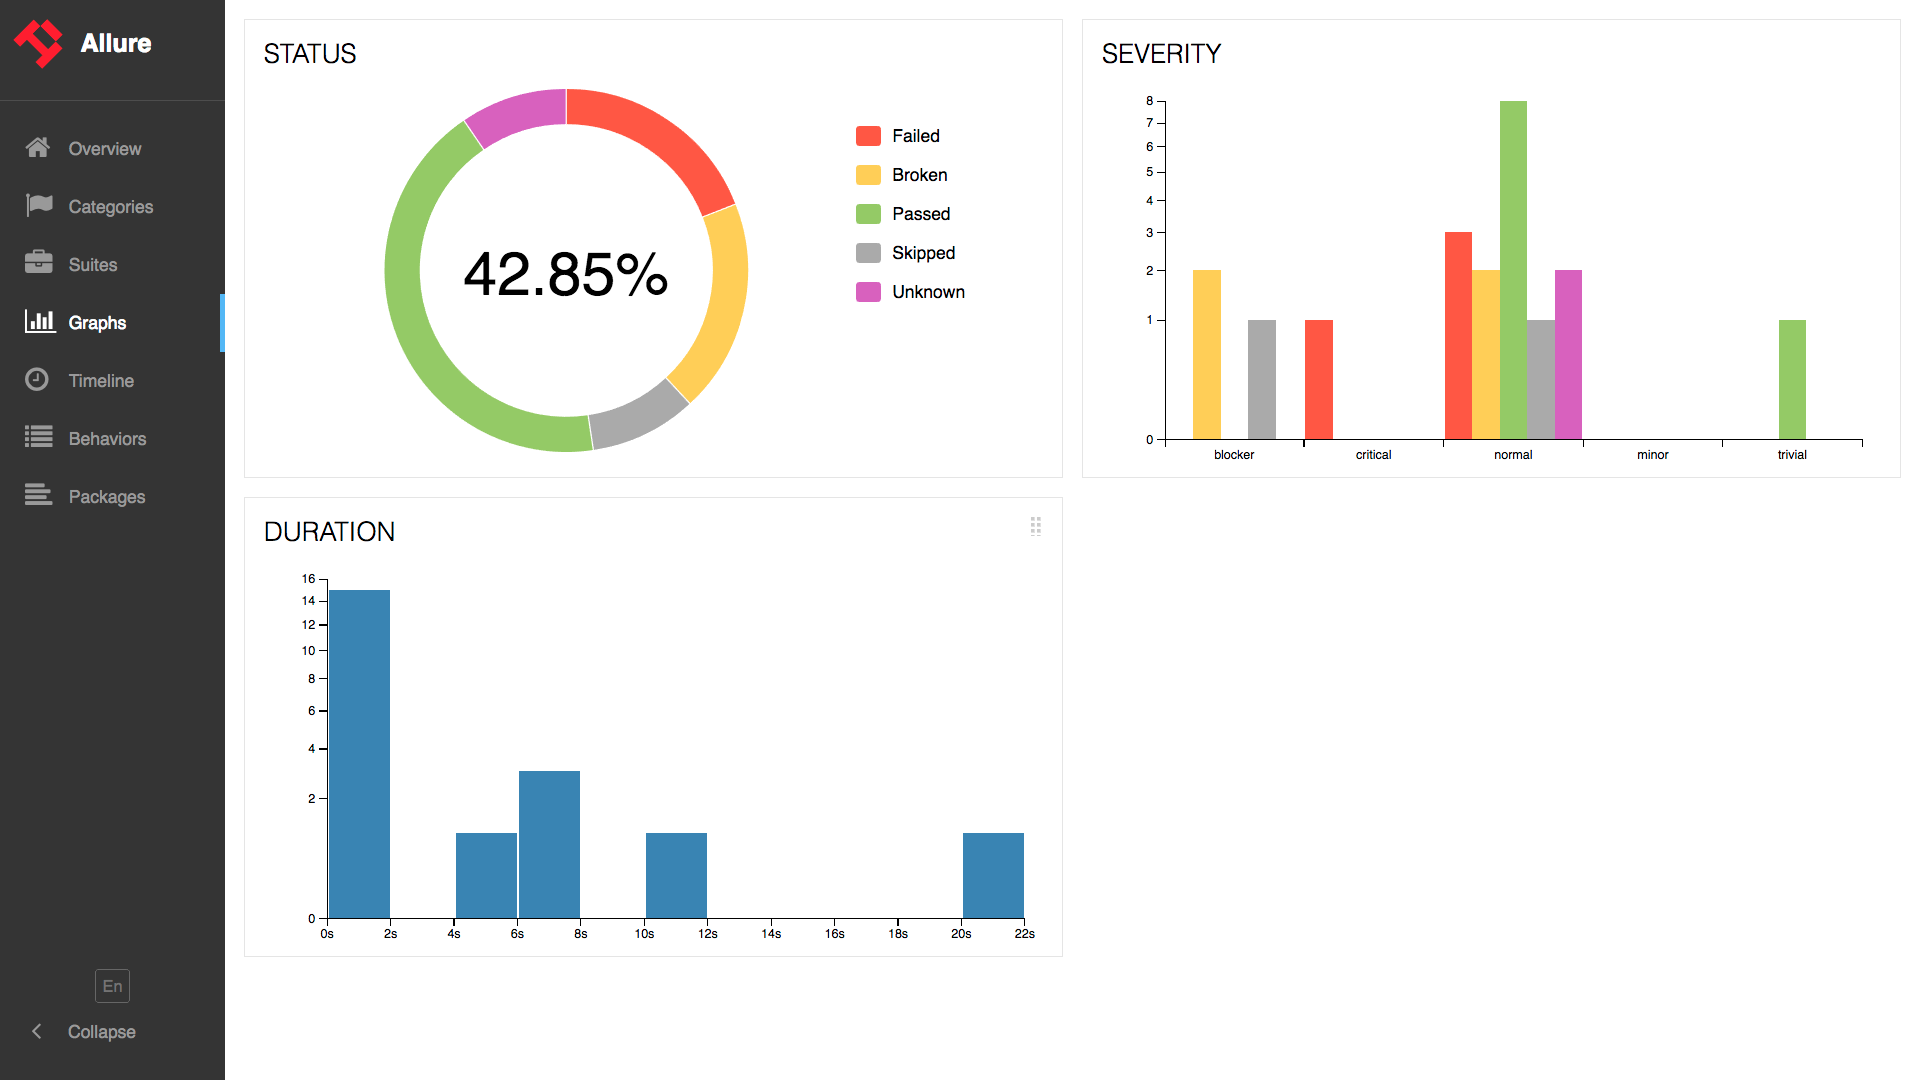
Graphs allow you to see different statistics collected from the test data: statuses breakdown or severity and duration diagrams.
Timeline
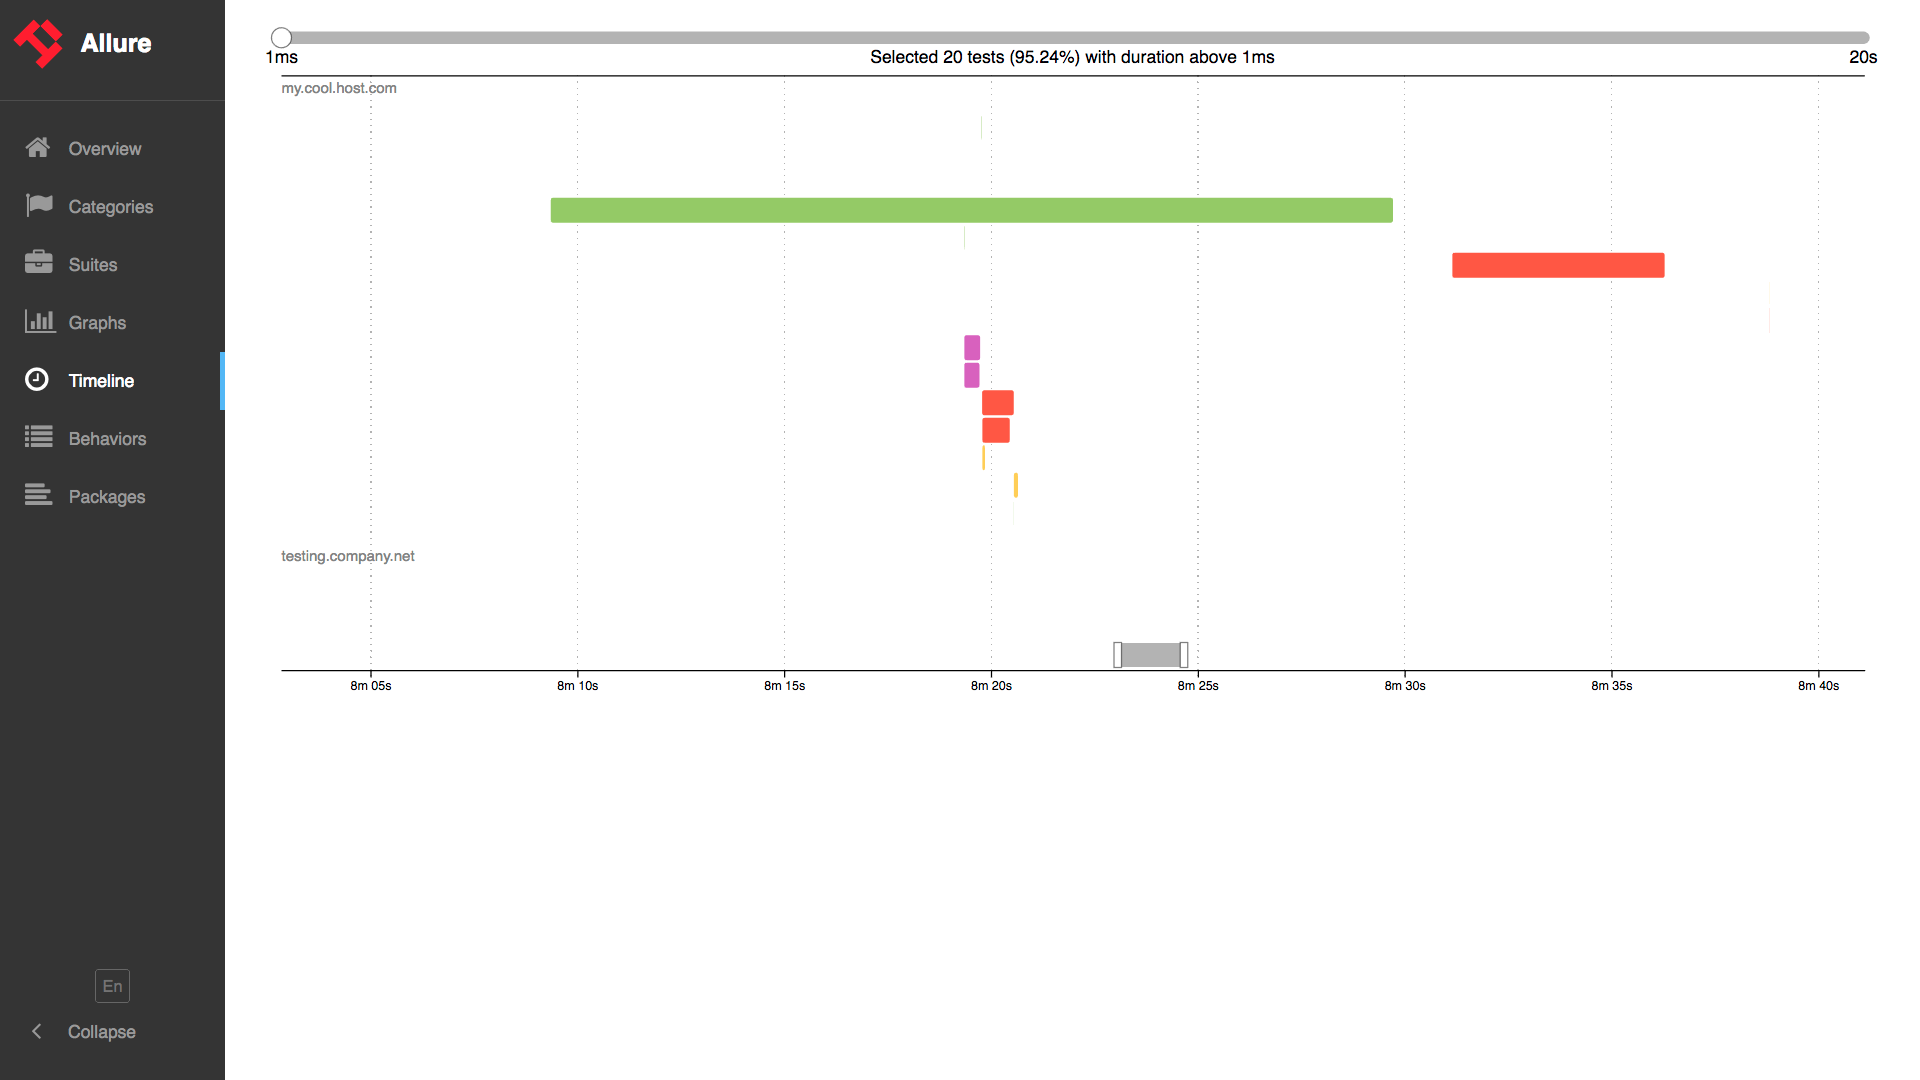
Timeline tab visualizes retrospective of tests execution, allure adaptors collect precise timings of tests, and here on this tab they are arranged accordingly to their sequential or parallel timing structure.
Behaviors
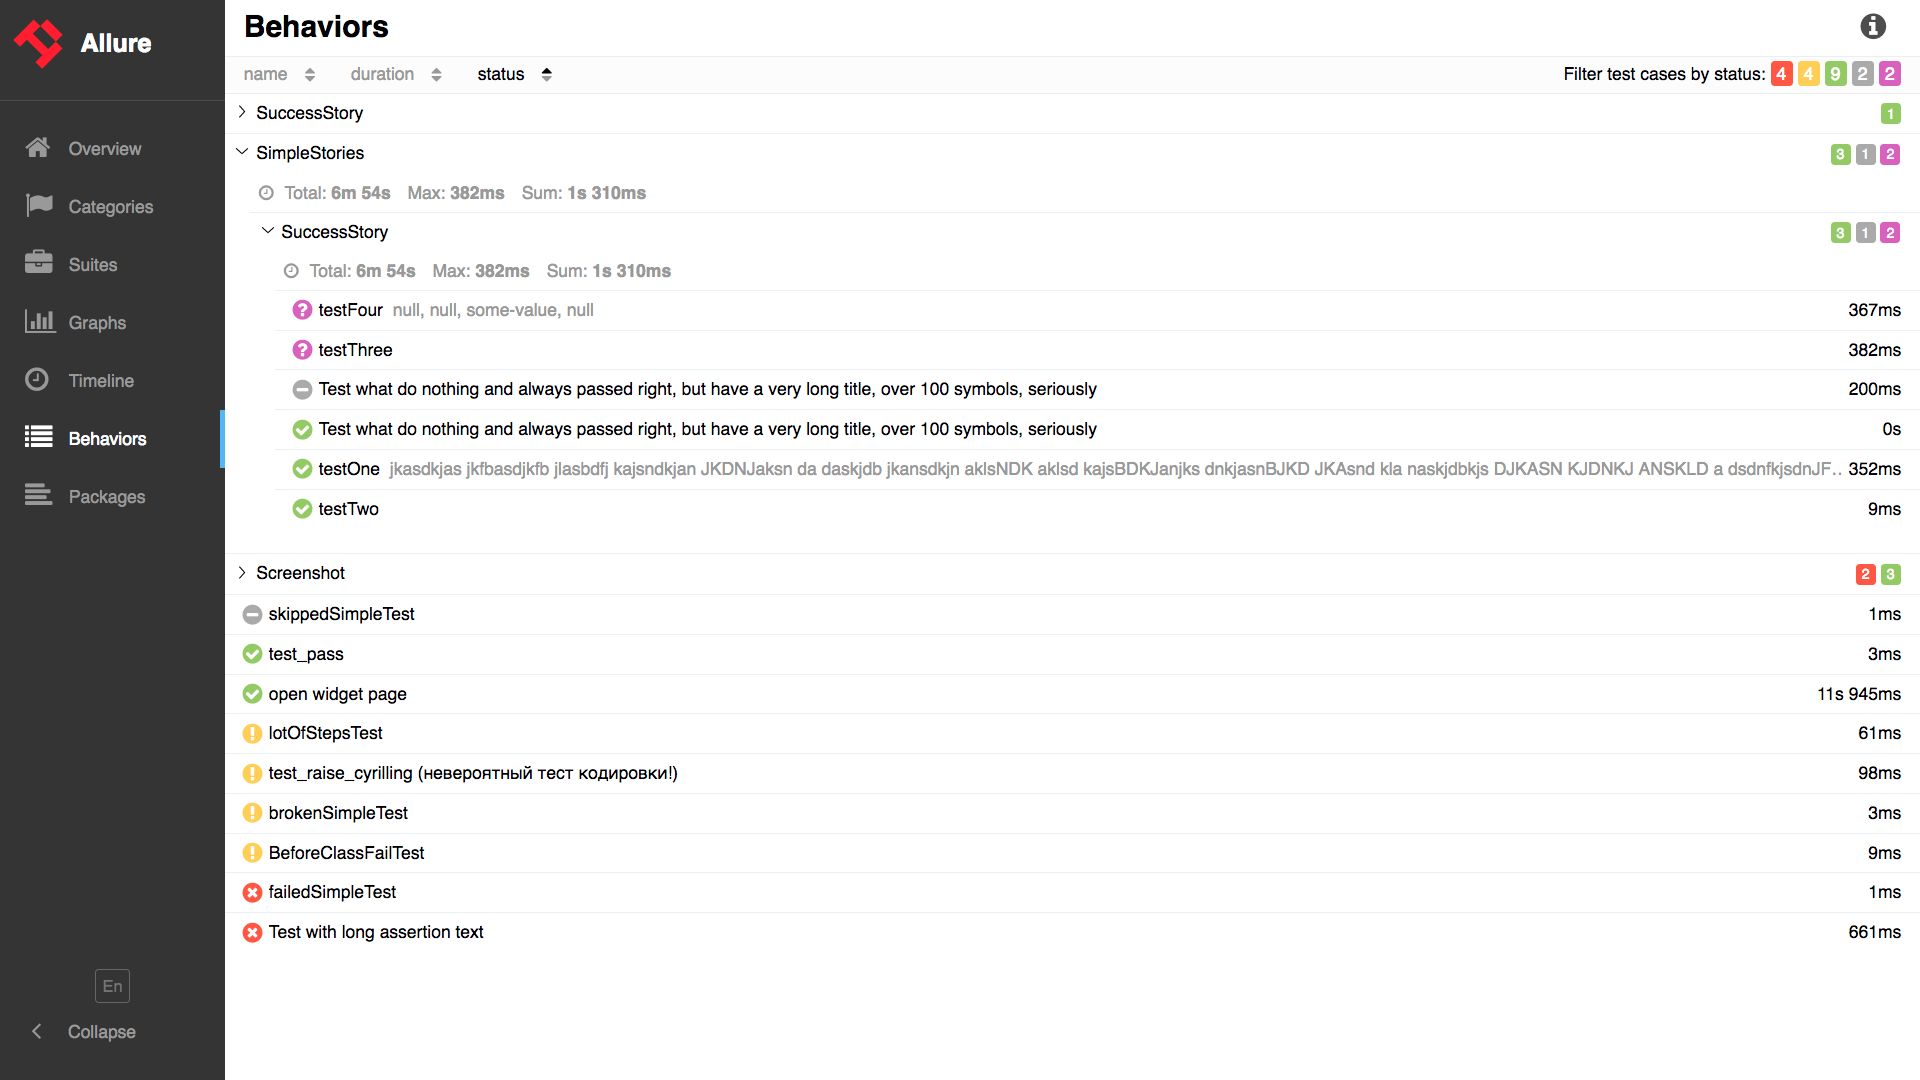
For Behavior-driven approach, this tab groups test results according to Epic, Feature and Story tags.
Packages
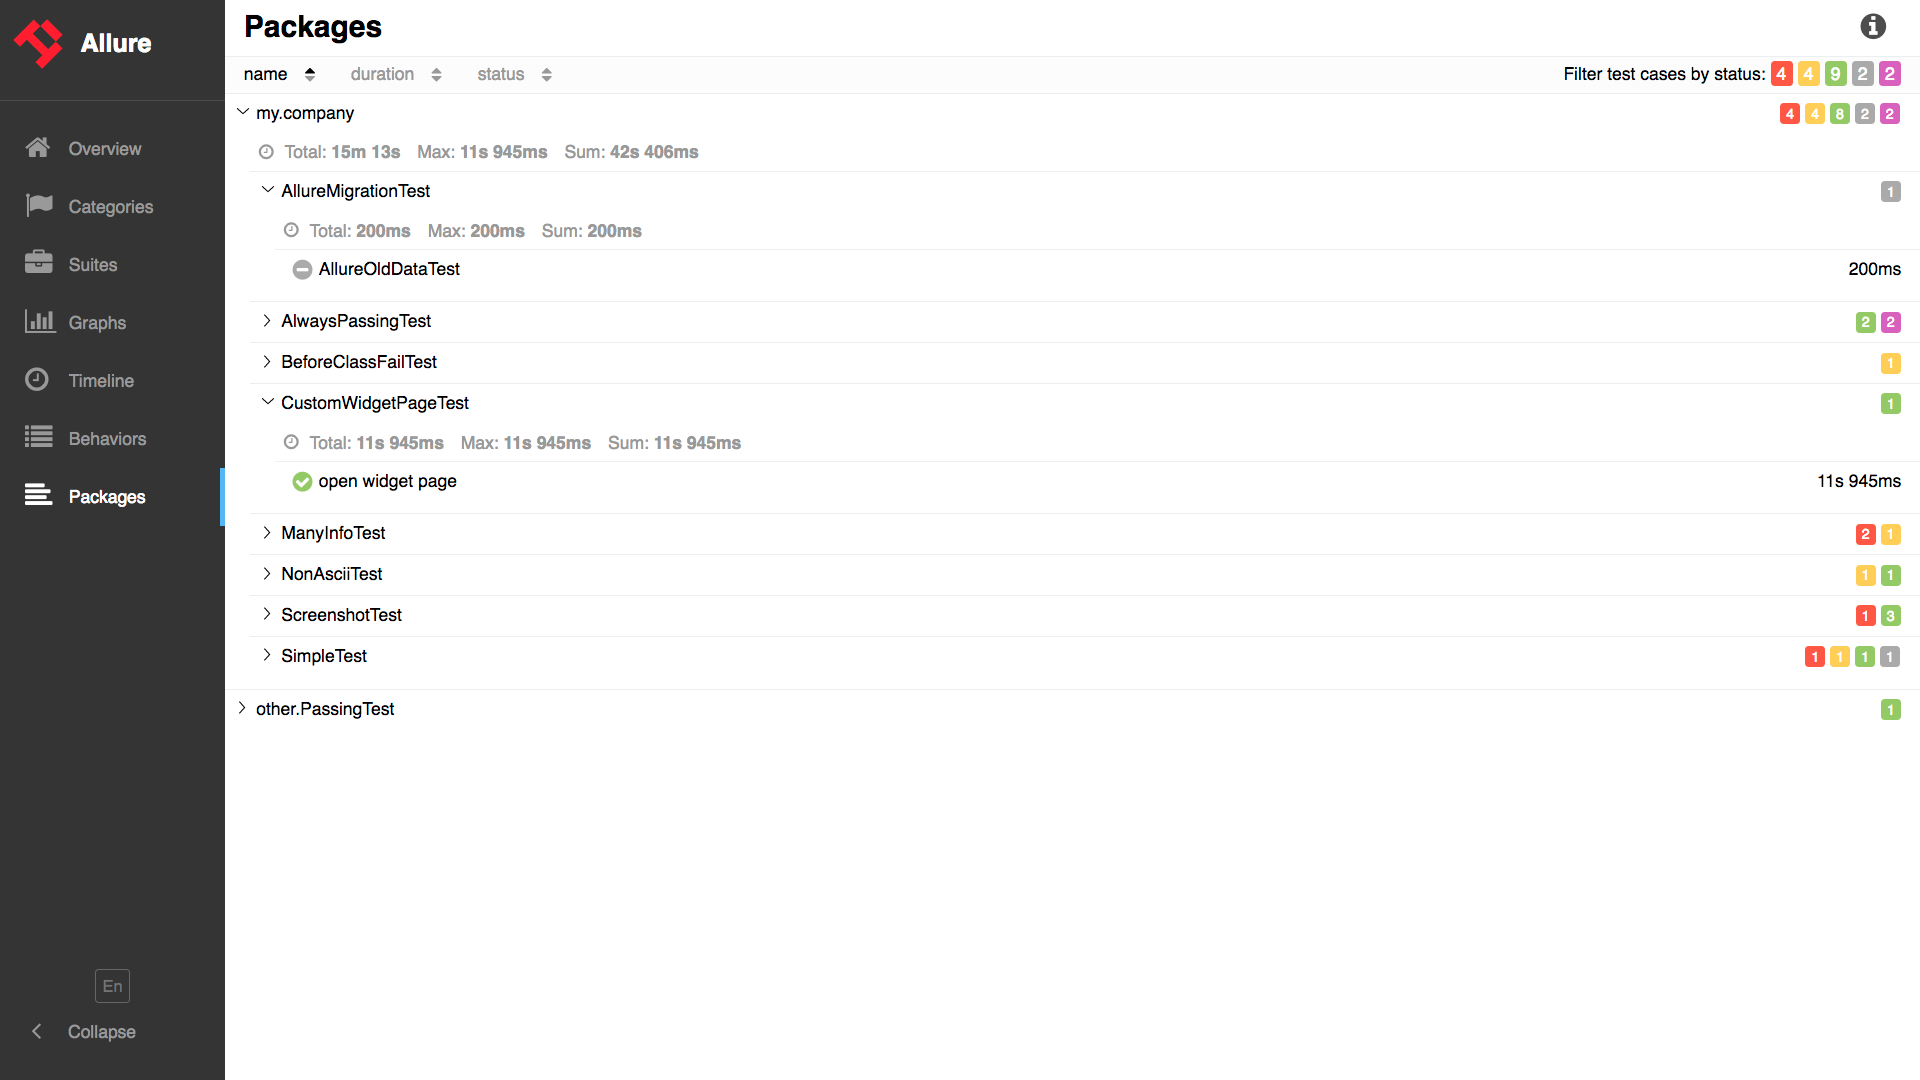
Packages tab represents a tree-like layout of test results, grouped by different packages.
Test case page
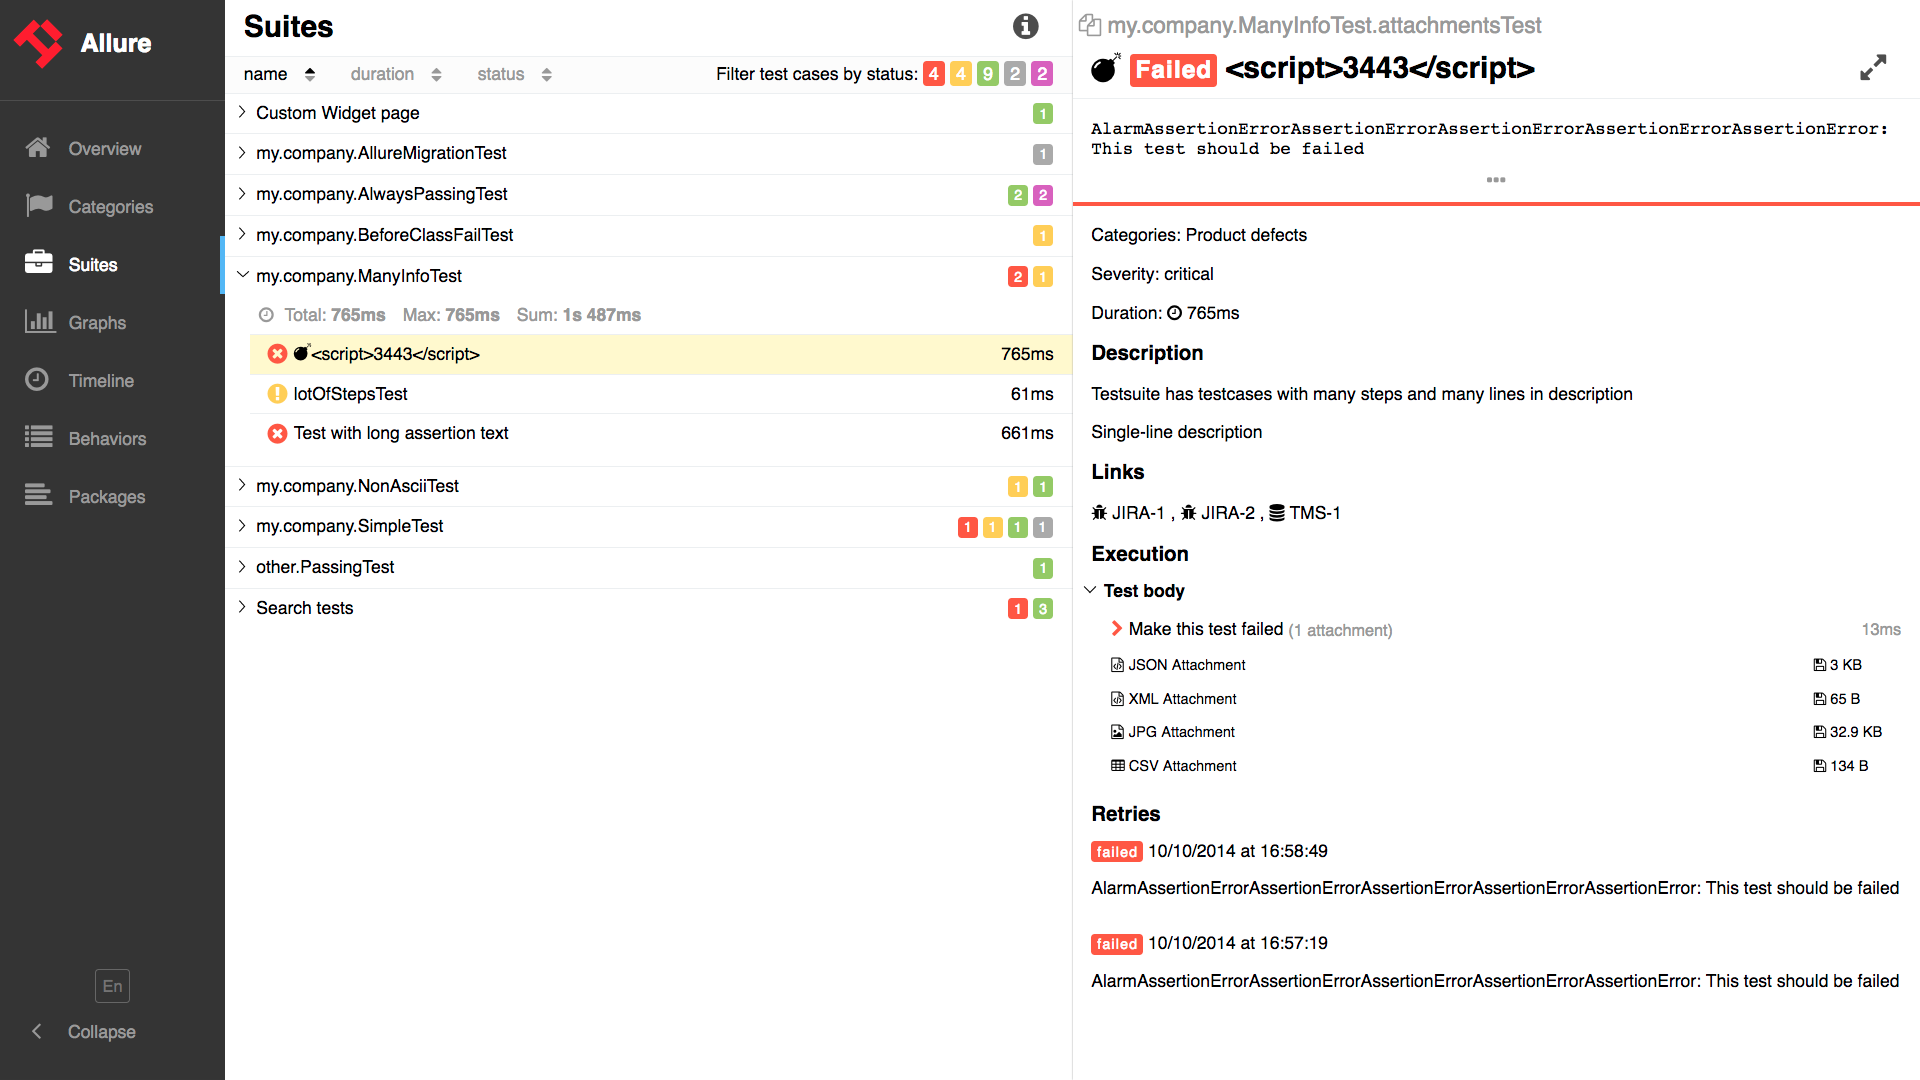
From some of the results overview pages described above you can go to the test case page after clicking on the individual tests. This page will typically contain a lot of individual data related to the test case: steps executed during the test, timings, attachments, test categorization labels, descriptions and links.
Features
This section describes the main features of Allure. For example, you can group your tests by stories or features, attach files, and distribute assertions over a set of custom steps, among other features. All features are supported by Java test frameworks, so we only provide Java examples here. For details on how a particular adapter works with the test framework of your choice, refer to the adapter guide.
Flaky tests
In real life not all of your tests are stable and always green or always red. A test might start to "blink" i.e. it fails from time-to-time without any obvious reason. You could disable such a test, that is a trivial solution. However what if you do not want to do that? Say you would like to get more details on possible reasons or the test is so critical that even being flaky it provides helpful information? You have an option now to mark such tests in a special way, so the resulting report will clearly show them as unstable:
@Flaky
public void aTestWhichFailsFromTimeToTime {
     ...
}
@Flaky
public void aTestWhichFailsFromTimeToTime {
...
}Here is what you get in the report if such a test failed:

TIP
you can mark a whole test class as flaky as well.
Environment
To add information to Environment widget just create environment.properties (or environment.xml) file to allure-results directory before report generation.
# environment.properties
Browser=Chrome
Browser.Version=63.0
Stand=Production
# environment.properties
Browser=Chrome
Browser.Version=63.0
Stand=Production<!-- environment.xml -->
<environment>
<parameter>
<key>Browser</key>
<value>Chrome</value>
</parameter>
<parameter>
<key>Browser.Version</key>
<value>63.0</value>
</parameter>
<parameter>
<key>Stand</key>
<value>Production</value>
</parameter>
</environment><!-- environment.xml -->
<environment>
<parameter>
<key>Browser</key>
<value>Chrome</value>
</parameter>
<parameter>
<key>Browser.Version</key>
<value>63.0</value>
</parameter>
<parameter>
<key>Stand</key>
<value>Production</value>
</parameter>
</environment>Categories
There are two categories of defects by default:
Product defects (failed tests)
Test defects (broken tests)
To create custom defects classification add categories.json file to allure-results directory before report generation.
// categories.json
[
  {
    "name": "Ignored tests",   // (mandatory) category name
    "matchedStatuses": ["skipped"]  // (optional) list of suitable test statuses. Default ["failed", "broken", "passed", "skipped", "unknown"]
  },
  {
    "name": "Infrastructure problems",
    "matchedStatuses": ["broken", "failed"],
    "messageRegex": ".*bye-bye.*"  // (optional) regex pattern to check test error message. Default ".*"
  },
  {
    "name": "Outdated tests",
    "matchedStatuses": ["broken"],
    "traceRegex": ".*FileNotFoundException.*"  // (optional) regex pattern to check stack trace. Default ".*"
  },
  {
    "name": "Product defects",
    "matchedStatuses": ["failed"]
  },
  {
    "name": "Test defects",
    "matchedStatuses": ["broken"]
  }
]
// categories.json
[
{
"name": "Ignored tests", // (mandatory) category name
"matchedStatuses": ["skipped"] // (optional) list of suitable test statuses. Default ["failed", "broken", "passed", "skipped", "unknown"]
},
{
"name": "Infrastructure problems",
"matchedStatuses": ["broken", "failed"],
"messageRegex": ".*bye-bye.*" // (optional) regex pattern to check test error message. Default ".*"
},
{
"name": "Outdated tests",
"matchedStatuses": ["broken"],
"traceRegex": ".*FileNotFoundException.*" // (optional) regex pattern to check stack trace. Default ".*"
},
{
"name": "Product defects",
"matchedStatuses": ["failed"]
},
{
"name": "Test defects",
"matchedStatuses": ["broken"]
}
]Test result falls into the category if its status is in the list and both error message and stack trace match the pattern.
TIP
categories.json file can be stored in test resources directory in case of using allure-maven or allure-gradle plugins.